
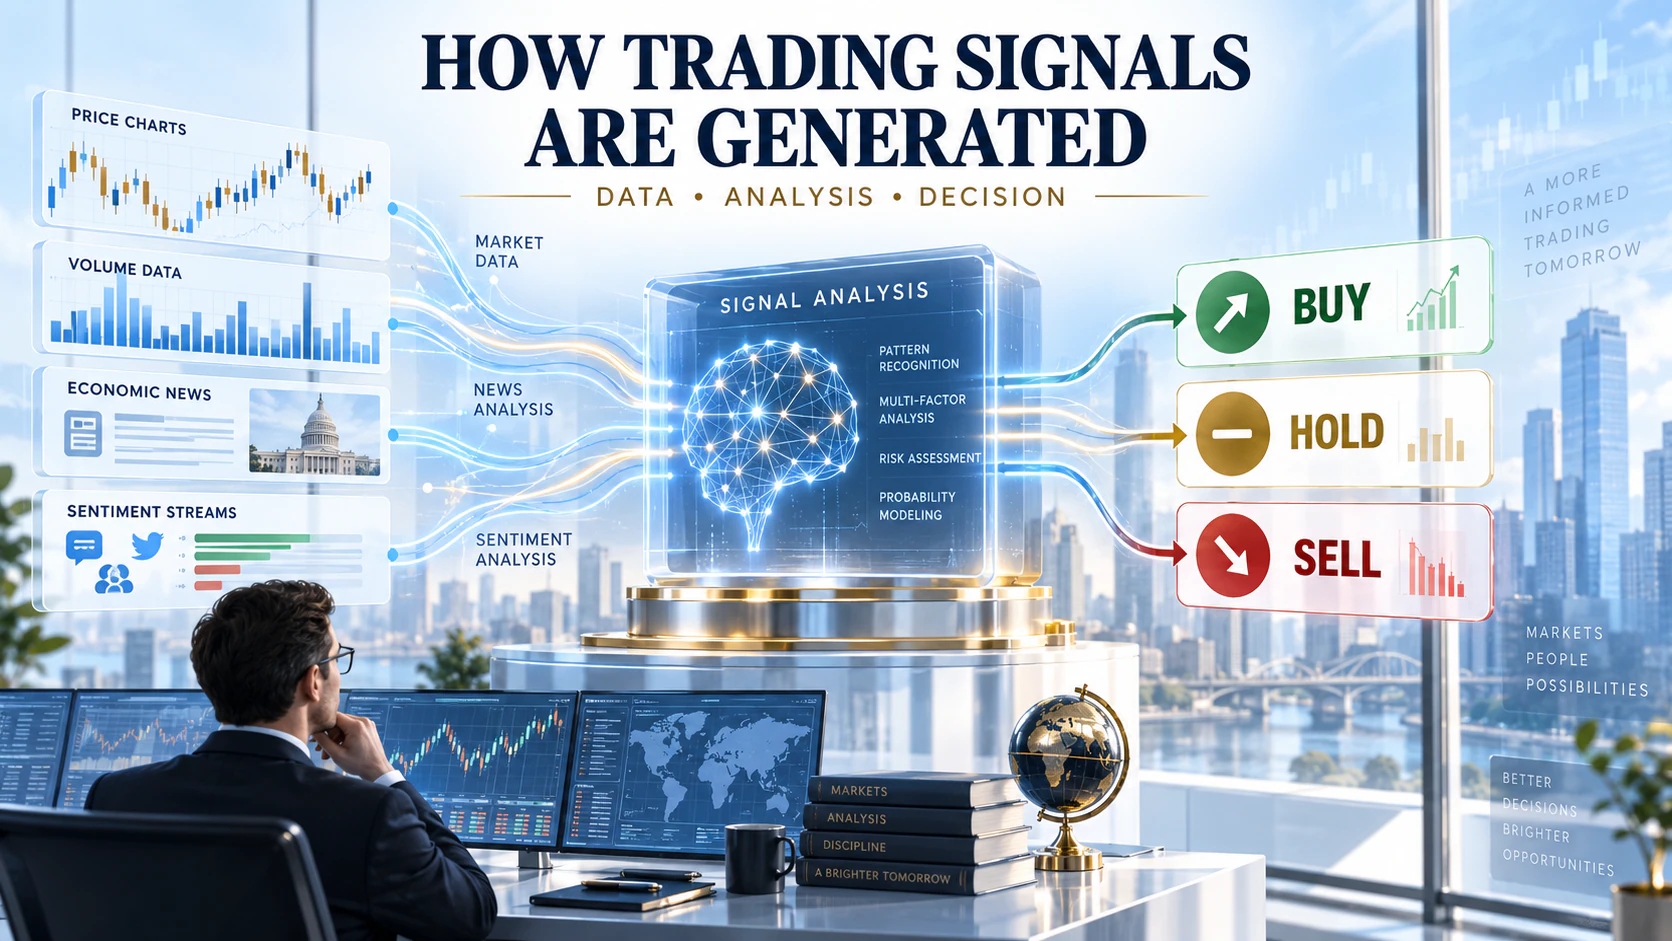
Financial markets generate a continuous stream of information. Prices move, trading volumes change, economic reports are released, and investor sentiment shifts—sometimes within seconds. Monitoring all these inputs at once can be difficult, which is why many traders use trading signals to identify and evaluate potential opportunities.
## What Are Trading Signals?
Trading signals are alerts or recommendations that indicate when a financial asset may present a potential buying, selling, or holding opportunity. They can be created by professional analysts, rule-based trading systems, quantitative models, or artificial intelligence.
A useful trading signal normally contains more than a simple “buy” or “sell” instruction. Depending on the provider and strategy, it may include the relevant asset, suggested entry price, stop-loss level, profit target, timeframe, and the reasoning behind the signal.
Signals are commonly available for forex, stocks, indices, commodities, precious metals, and digital assets. However, they represent probability-based assessments rather than guarantees of future price movements.
## The Main Types of Trading Signals
Trading signals can generally be divided into three categories: manual, automated, and hybrid.
Manual signals are produced by traders or market analysts. The analyst studies price charts, economic indicators, corporate fundamentals, central bank decisions, geopolitical developments, and market sentiment before identifying a possible opportunity.
Human analysts can interpret unusual events and changing market narratives that may be difficult to reduce to fixed rules. Their decisions, however, can also be affected by emotional bias, inconsistent judgment, or limited processing capacity.
Automated signals are generated by software, algorithms, or AI models. These systems continuously monitor market data and issue an alert whenever predefined conditions are met. They can process several markets simultaneously, respond quickly, and apply the same analytical criteria consistently.
Their effectiveness still depends on data quality, model design, and the market conditions in which they operate. An automated strategy developed during a stable market may perform very differently during a sudden crisis or period of extreme volatility.
Hybrid signals combine machine analysis with human review. A system may first scan large datasets and identify unusual activity, after which an analyst evaluates whether the opportunity makes sense within the wider market environment.
## How Are Trading Signals Generated?
Most signals are generated through one or more analytical methods.
### Technical Analysis
Technical signals are based on historical price and volume data. Systems may monitor moving averages, the Relative Strength Index, MACD, support and resistance levels, volatility measures, trading volume, and candlestick formations.
For example, a system might identify a bullish signal when a short-term moving average crosses above a longer-term moving average. If the price also breaks a resistance level and volume increases, the combination may strengthen the signal.
Using several indicators together can provide more context, but it does not eliminate uncertainty. Indicators often respond to the same underlying price data and may therefore produce misleading confirmation.
### Fundamental Analysis
Fundamental signals examine the economic or financial factors that may influence an asset’s value. These can include interest-rate decisions, inflation data, employment reports, corporate earnings, industry developments, and geopolitical events.
A signal may be generated when a new data release differs significantly from market expectations. However, the market’s reaction is not always determined by whether the result appears positive or negative. What matters is how the information compares with expectations and how investors interpret its future impact.
### Price Action and Market Structure
Price-action signals focus directly on how prices behave. Traders and automated systems may look for trend breakouts, reversals, consolidation ranges, momentum changes, and shifts in market structure.
Volume and liquidity can provide additional confirmation. A breakout supported by strong trading activity may be treated differently from a similar price movement occurring in a thin or illiquid market.
### News and Sentiment Analysis
Some signal systems analyze financial news, company announcements, analyst commentary, and public market discussions. Natural language processing can help classify this information and detect whether sentiment is becoming more positive, negative, or uncertain.
Sentiment signals can be valuable during rapidly developing events, but they also contain noise. Repeated stories, unreliable sources, sarcasm, coordinated online activity, and emotional reactions can all distort the result.
### AI and Multi-Factor Models
More advanced systems combine technical indicators, economic data, price action, news, and sentiment in a single model. Machine-learning systems can identify relationships that might not be visible through traditional analysis and update their assessments as new information arrives.
Nevertheless, greater complexity does not automatically produce greater accuracy. AI models can fail when their training data is incomplete, when market relationships change, or when they encounter conditions that were not represented during development.
## How Can Traders Evaluate a Signal?
A signal should not be judged only by its advertised win rate. Traders should examine whether its methodology is transparent, whether historical results can be verified, and whether transaction costs, spreads, slippage, and losing trades are included in the performance record.
Compatibility is equally important. A signal designed for short-term scalping may be unsuitable for a position trader, while a model built for low-volatility markets may become unreliable around major economic announcements.
Before committing substantial capital, traders can test signals using historical data, a demo account, or a limited position size. Maintaining a trading journal can reveal which signals perform consistently, under what conditions they work, and how execution affects the final outcome.
## Why Risk Management Still Matters
Even a well-designed signal can fail because of unexpected news, execution delays, price gaps, changing liquidity, or sudden volatility. For this reason, signals should operate within a broader risk-management framework.
Traders can define stop-loss levels, control position sizes, limit exposure to correlated assets, and establish a maximum acceptable loss before entering a trade. No signal should justify excessive leverage or the abandonment of independent judgment.
Trading signals are most valuable when they help organize information and support disciplined decision-making. Their purpose is not to predict the market with certainty, but to transform complex data into structured, testable insights.
As signal generation becomes increasingly automated, understanding the data, assumptions, and risk controls behind each alert will become even more important. KAEL AI will continue exploring these developments through its ongoing market-technology insights on [X](https://x.com/KAELAI001).