
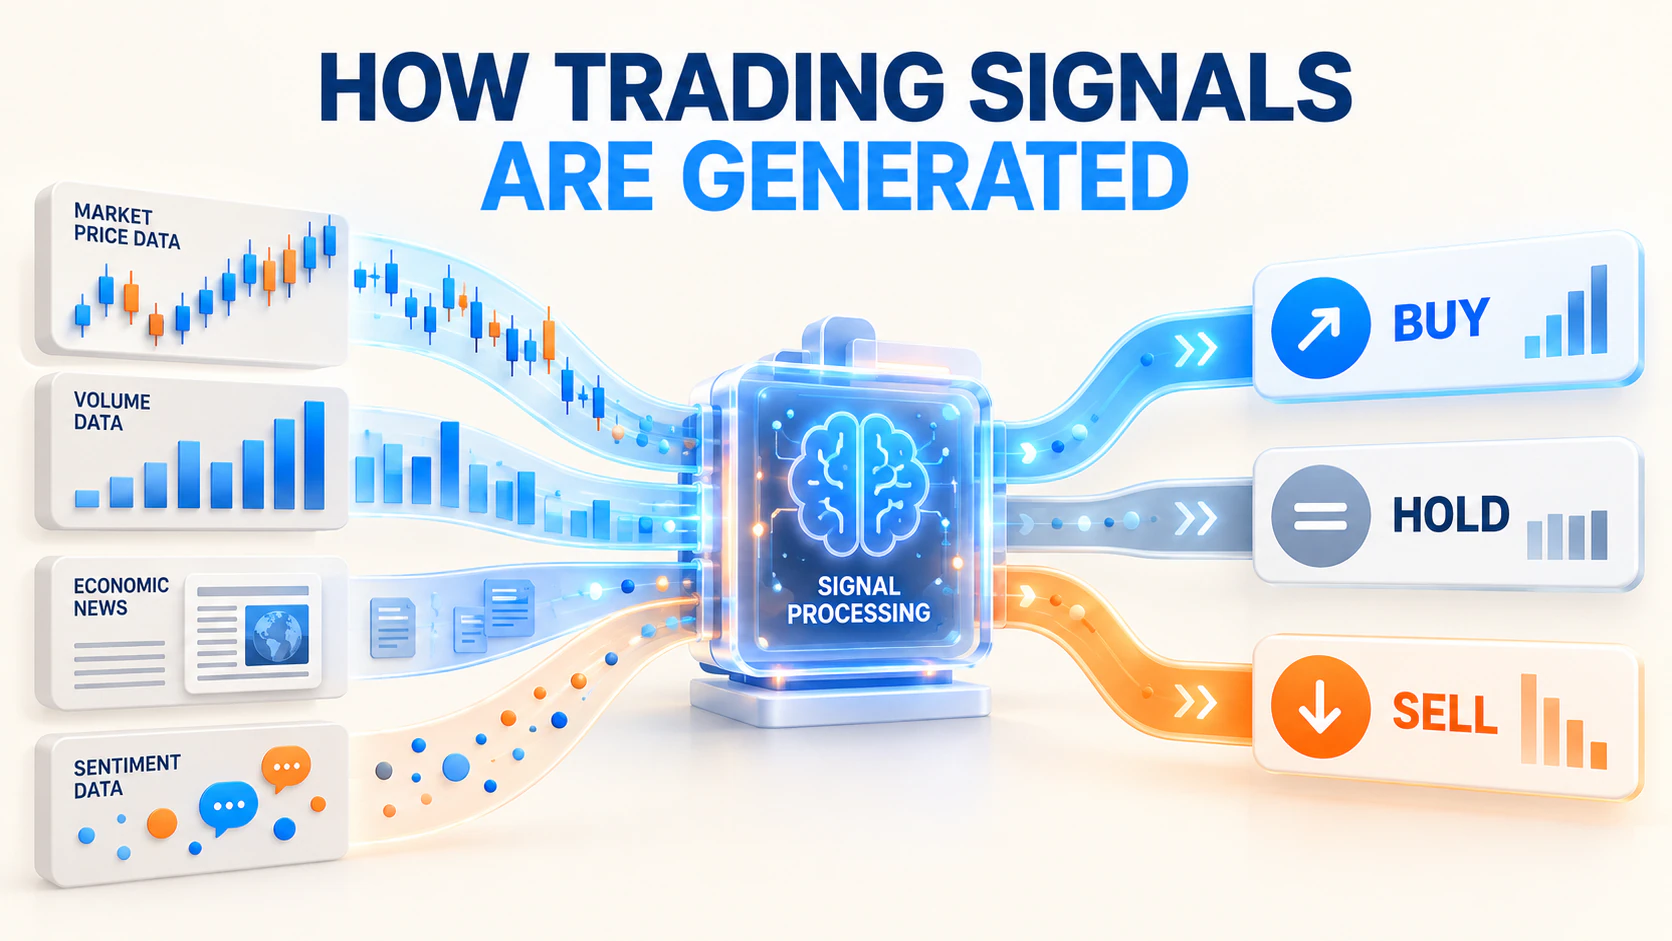
Financial markets generate a constant stream of prices, trading volumes, economic reports, news, and sentiment data. The challenge for traders is not simply gaining access to information, but deciding which changes are meaningful. Trading signals help solve this problem by converting market data into structured indications that can support decisions to buy, sell, hold, or avoid a financial asset.
A trading signal is not a guarantee about the market’s next move. It is a conditional assessment based on a particular analytical method. When predefined conditions are met, the signal indicates that a potential opportunity—or risk—may be developing.
A useful signal often contains more than a simple directional recommendation. It may specify the asset, entry condition, expected direction, target area, stop-loss level, applicable timeframe, risk classification, and the conditions that would invalidate the original idea.
## What Information Does a Trading Signal Provide?
Basic trading signals may contain only a “buy” or “sell” alert, but these instructions offer little context on their own. More complete signals attempt to answer several practical questions.
The first is what to trade, such as a currency pair, stock, index, commodity, or digital asset. The second is the intended direction: long, short, hold, or remain out of the market. A signal should also define its trigger, such as a breakout above resistance, a move below support, or a technical indicator reaching a specified level.
Timeframe is equally important. A signal derived from a five-minute chart may be relevant for only a short period and would not automatically suit a position intended to remain open for several weeks. Stop-loss and profit-taking levels also help transform an observation into a risk-controlled trading plan.
## How Are Trading Signals Generated?
Trading signals can be generated through technical analysis, fundamental analysis, price-action analysis, sentiment analysis, or a combination of these methods.
Technical signals are based primarily on historical price and volume data. Moving averages may help identify the direction of a trend, while the Relative Strength Index can indicate when momentum has become unusually strong or weak. MACD, Bollinger Bands, support and resistance levels, candlestick formations, and volume indicators are also commonly used.
For example, a system might produce a bullish signal when a short-term moving average crosses above a longer-term average while trading volume increases. Because individual indicators frequently generate noise, more robust strategies usually require confirmation from several conditions.
Fundamental signals use economic, financial, and business information. Interest-rate decisions, inflation figures, employment reports, corporate earnings, industry developments, and geopolitical events can all affect asset prices. A currency strategy may focus on differences in central-bank policy, while an equity strategy may evaluate revenue growth, profitability, valuation, and management guidance.
Price-action signals concentrate on the behavior of price itself. Breakouts, pullbacks, reversals, trend continuation patterns, volatility changes, and reactions around important price levels can all become signal inputs.
Sentiment-based signals attempt to measure whether market participants are broadly optimistic, pessimistic, or uncertain. Positioning reports, fund flows, volatility measures, news analysis, and social-media activity may contribute to this assessment. However, extreme sentiment can indicate either strong trend continuation or an approaching reversal, so context remains essential.
## Manual, Automated, and Hybrid Signals
Manual trading signals are created by analysts or experienced traders who interpret charts, economic data, news, and broader market conditions. Human analysts can consider unusual events and complex context, but their conclusions may be influenced by emotion, inconsistency, or personal bias.
Automated signals are produced by rule-based programs, statistical models, or artificial intelligence systems. These systems can process large amounts of data continuously and issue alerts as soon as their conditions are satisfied. They apply the same logic consistently and are not directly affected by fear or greed.
Automation does not make a signal automatically reliable. Every model depends on its data, assumptions, parameters, and design choices. A strategy that performed well historically may become less effective when market behavior changes.
Hybrid systems combine both approaches. A model may identify possible opportunities, while a human reviews the market environment and decides whether the risks justify execution.
## From Market Data to an Actionable Signal
The signal-generation process usually begins with collecting relevant market data. This data may include prices, volume, economic indicators, financial statements, news, or alternative datasets. It must then be checked for missing observations, errors, outliers, and timing inconsistencies.
Raw data is transformed into measurable features such as momentum, trend strength, volatility, valuation changes, or sentiment scores. A rule or model then evaluates whether those features meet the strategy’s requirements.
Before an alert is released, additional filters may be applied. A system might accept a bullish signal only when the longer-term trend is positive, liquidity is sufficient, and volatility remains below a risk limit. The approved signal is then delivered to a trader or, when authorized, sent to an automated execution system.
This process shows why signal quality depends on much more than the final buy or sell label. Data reliability, model logic, filtering, communication speed, and execution quality can all affect the result.
## How Can Signal Quality Be Evaluated?
Win rate alone is not enough to judge a trading signal. A strategy can win frequently but still lose money if its average loss is much larger than its average gain. Conversely, a lower-win-rate strategy may remain profitable if successful trades substantially outweigh unsuccessful ones.
A broader evaluation should examine average profit and loss, risk-to-reward ratio, maximum drawdown, trade frequency, transaction costs, slippage, and performance under different market conditions. Historical testing should also account for overfitting by evaluating the strategy on data that was not used to design it.
Transparency matters as well. Users should understand what data the signal uses, which market and timeframe it was designed for, and what conditions can cause it to fail. Performance claims are difficult to assess when they exclude fees, drawdowns, or losing periods.
## Why Do Trading Signals Fail?
Market behavior changes over time. A momentum signal that performs well during strong trends may generate repeated false alerts in a range-bound market. A strategy designed for calm conditions may struggle when major news causes volatility to rise suddenly.
Execution can create another gap between theoretical and actual results. The price available when a signal is generated may differ from the price at which a trade is filled. Delays, widening spreads, limited liquidity, and slippage can reduce or eliminate an expected advantage.
Signals may also lose effectiveness when many market participants begin using similar data and rules. For this reason, historical success should never be treated as proof of permanent reliability.
## Using Trading Signals Responsibly
Trading signals are most useful as decision-support tools rather than substitutes for independent judgment. A signal should match the trader’s timeframe, objectives, capital, and risk tolerance. Short-term signals require fast execution and close control of trading costs, while longer-term signals may involve wider price fluctuations and longer holding periods.
Before committing significant capital, traders can test signals through historical analysis, simulated trading, or limited position sizes. They should define the maximum risk for each trade, total portfolio exposure, and the conditions under which a signal or strategy will be suspended.
Using several signals does not necessarily create diversification. If they rely on similar indicators or market assumptions, they may all fail at the same time. Genuine diversification requires examining how the signals relate to one another, not merely increasing their number.
The real value of a trading signal lies in turning complex information into a decision process that can be tested, executed, and managed. No signal can remove uncertainty, but a well-designed framework can help traders respond to it with greater consistency and discipline.