
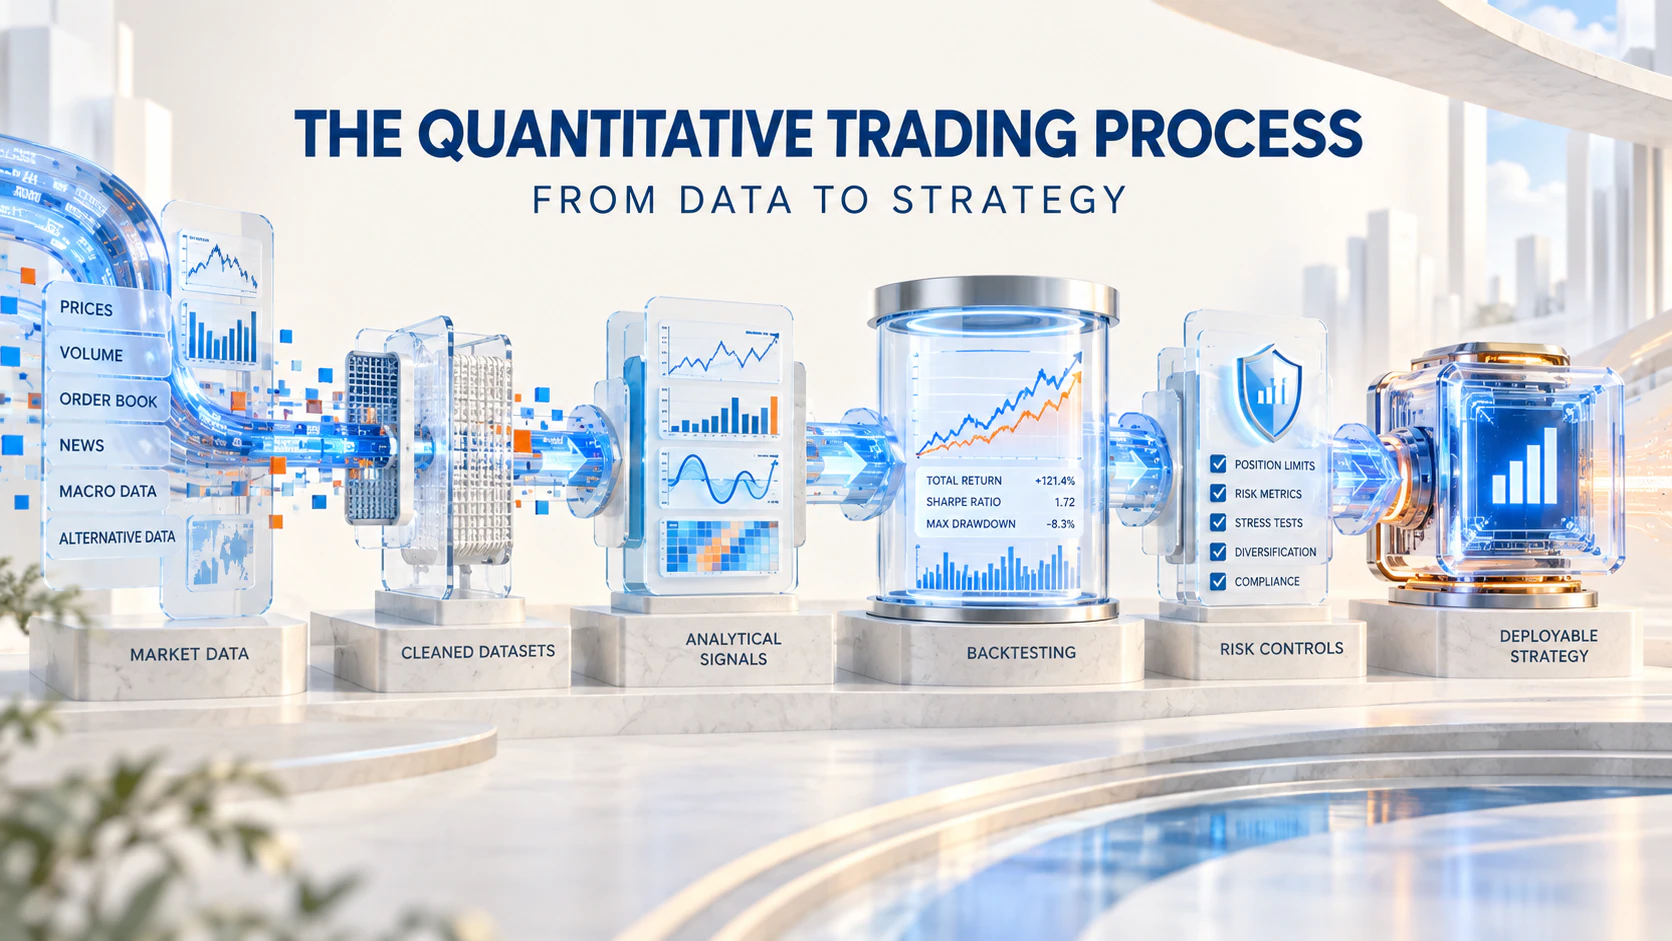
Quantitative trading is often described as the use of mathematical models, statistical analysis, and computer algorithms to identify and execute trading opportunities. In practice, however, a viable quantitative strategy does not emerge simply by feeding market data into a computer. It is developed through a structured research process that connects data, hypotheses, testing, execution, and risk management.
Each stage matters. Weak data can distort an otherwise sound idea, unrealistic backtesting can create misleading results, and poor execution can erase a strategy’s theoretical advantage. Understanding the full process helps explain how quantitative researchers turn an initial market observation into a strategy that can operate under real-world conditions.
The process begins with a research question. Instead of searching blindly for patterns, researchers usually define a hypothesis that can be tested. They might ask whether assets with strong recent performance tend to continue rising, whether temporary price differences between related securities eventually converge, or whether certain fundamental characteristics are associated with future returns.
A clear hypothesis gives the research direction. It identifies the expected market behavior, the information required to study it, and the conditions under which the idea might fail. This is important because large datasets contain countless accidental relationships. Without an economic or behavioral rationale, researchers can easily mistake random historical patterns for persistent opportunities.
Once the question has been defined, the next task is acquiring suitable data. Common inputs include historical prices, trading volume, order book information, asset correlations, company fundamentals, and macroeconomic indicators. Some models may also use options data, news, regulatory filings, satellite observations, or other alternative sources.
More data does not automatically produce a better strategy. The information must be accurate, relevant, and available at the time a historical decision would have been made. Researchers therefore examine timestamps, missing observations, corporate actions, changes in asset listings, and inconsistent data definitions. They must also guard against survivorship bias, which occurs when a dataset excludes securities that disappeared, and look-ahead bias, which occurs when a model uses information that was not yet known.
After the data has been collected, it must be cleaned and organized. Missing values may need to be handled, extreme observations investigated, prices adjusted for dividends or stock splits, and records from multiple sources aligned. This stage can require substantial effort, but it is essential. A model built on faulty inputs may appear sophisticated while producing unreliable conclusions.
Researchers then transform the cleaned data into features—measurable variables intended to represent the original hypothesis. Examples include recent returns, moving-average differences, valuation ratios, changes in trading volume, volatility, or the spread between related assets. Feature design converts a general market idea into information that a model can evaluate consistently.
The next stage is signal and model development. A simple model might buy an asset when its momentum exceeds a defined threshold and sell when the signal weakens. More advanced systems may use regression, time-series analysis, machine learning, portfolio optimization, or combinations of several techniques.
Regardless of complexity, the model needs explicit rules. It must determine when to enter or exit a position, how much capital to allocate, how frequently to trade, and what conditions should reduce or suspend exposure. Complexity should serve the hypothesis rather than conceal it. A model that is difficult to explain may also be difficult to diagnose when market behavior changes.
Backtesting applies these rules to historical data. Its purpose is to estimate how the strategy might have behaved across different environments. Researchers evaluate more than total return: they also examine volatility, drawdowns, risk-adjusted performance, turnover, loss frequency, exposure concentration, and consistency across time periods and markets.
A credible backtest must reflect realistic trading conditions. Commissions, bid-ask spreads, slippage, borrowing costs, market impact, liquidity constraints, and execution delays can materially reduce performance. This is especially important for high-turnover strategies, where a small theoretical advantage may disappear after costs.
Overfitting is another major concern. If researchers repeatedly adjust a model until it performs exceptionally well on one historical sample, the result may simply describe past noise. To reduce this risk, the data can be divided into training and testing periods. Researchers may also use walk-forward analysis, test the strategy across different assets, vary important parameters, and reserve untouched data for final validation.
Robust strategies do not need to produce identical results under every test, but their performance should not depend on one precise parameter or a narrow market episode. A gradual decline in results as assumptions change is generally more credible than a model that works only at a single optimized setting.
A successful backtest is not the end of the process. Before significant capital is committed, the strategy is often evaluated through paper trading or a small live deployment. This stage tests the complete system: incoming data, signal calculations, order generation, broker connectivity, fills, transaction costs, and risk controls.
The distinction between a model and an executable strategy becomes especially important here. A model may recommend a target position instantly, but real markets introduce latency, partial fills, changing prices, limited liquidity, and operational failures. Execution design determines how theoretical signals are translated into actual orders and how aggressively those orders interact with the market.
Risk management must be incorporated throughout the process rather than added after development. Position limits, leverage constraints, diversification requirements, stop conditions, and maximum loss thresholds help control exposure. Researchers also examine whether multiple strategies that appear different are actually dependent on the same underlying market factor.
After deployment, the strategy requires continuous monitoring. Live results are compared with historical expectations, while signal strength, execution quality, transaction costs, data integrity, and risk exposures are tracked. Deviations may reflect ordinary variation, implementation problems, increased competition, or a deeper change in market structure.
Quantitative models can lose effectiveness because financial markets evolve. Participants adapt, regulations change, liquidity shifts, and profitable ideas attract competitors. A strategy therefore needs a defined process for review, recalibration, reduction, or retirement. Updating a model should be based on evidence rather than a reaction to every short-term loss.
The quantitative trading process is best understood as a continuous research cycle rather than a direct path from data to profit. Data supports a hypothesis, the hypothesis becomes a model, the model is tested under realistic assumptions, and the resulting strategy is deployed with execution and risk controls. Live evidence then feeds back into the next round of research.
Computers can process more information than a human trader and apply rules without fear or greed. They cannot guarantee that the data is correct, the hypothesis is valid, or the future will resemble the past. The lasting strength of a quantitative strategy comes from disciplined research, realistic validation, careful implementation, and a willingness to recognize when a model no longer works.